

The 60-second version
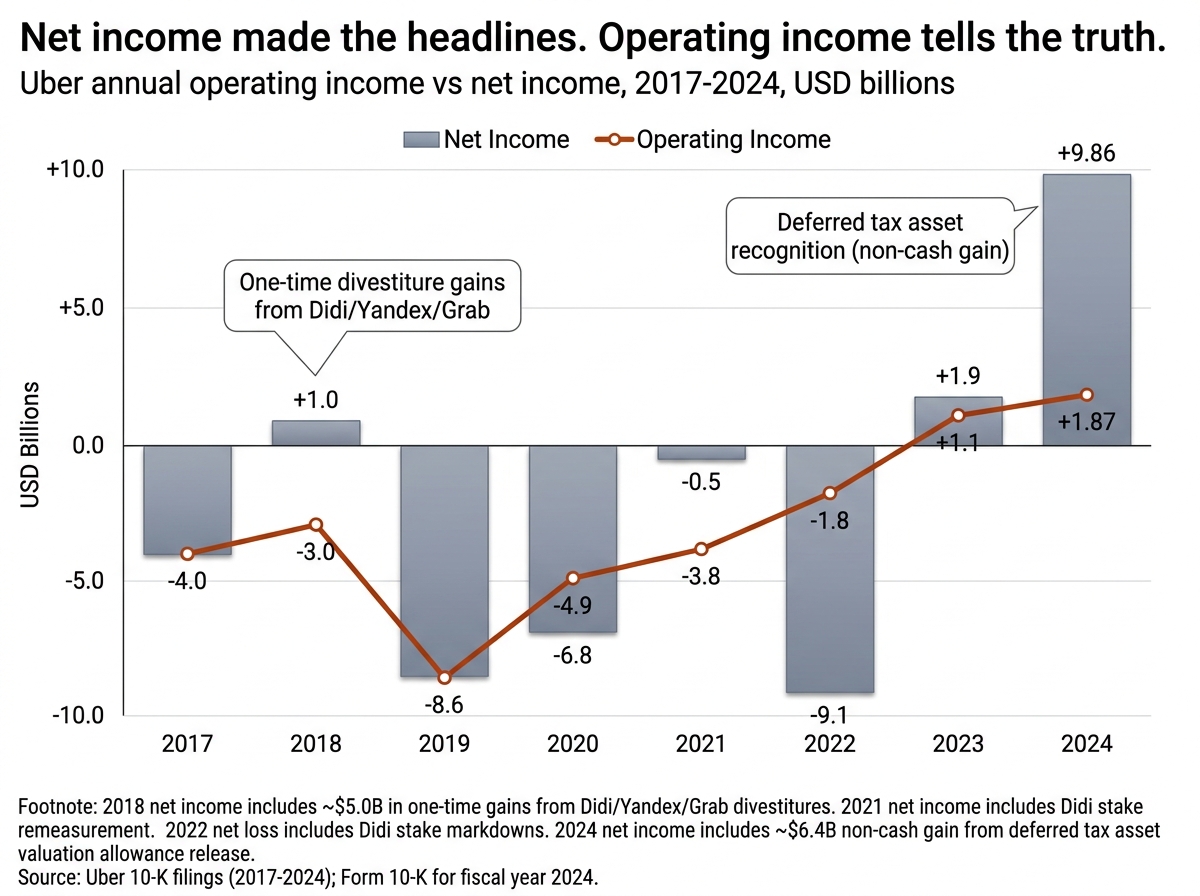
For 14 years, Uber lost money. Cumulative operating losses from 2014 through 2022 totaled roughly $31.5 billion before the company posted its first full-year operating profit in 2023. Then in 2024, Uber reported $9.86 billion in net income, alongside $43.9 billion in revenue and $1.87 billion in operating profit.
The popular explanation — better technology, network effects, scale economics — collapses the moment you read the actual filings. The real story is geographic and competitive:
- Capital scale that no rational competitor could match. Uber raised more than $24 billion in venture and PE funding before its 2019 IPO, with SoftBank deploying about $9.3 billion from its Vision Fund and Saudi Arabia’s Public Investment Fund wiring a single $3.5 billion check in 2016 — at the time, the largest lump-sum payment ever sent.
- Three strategic retreats that look like victories. Uber sold its China business to Didi (August 2016), merged its Russia/Eastern Europe operations into a Yandex JV (July 2017), and sold Southeast Asia to Grab (March 2018) — each in exchange for an equity stake. Uber recorded billions in non-operating gains from those exits, while exiting the markets where it was losing the most money.
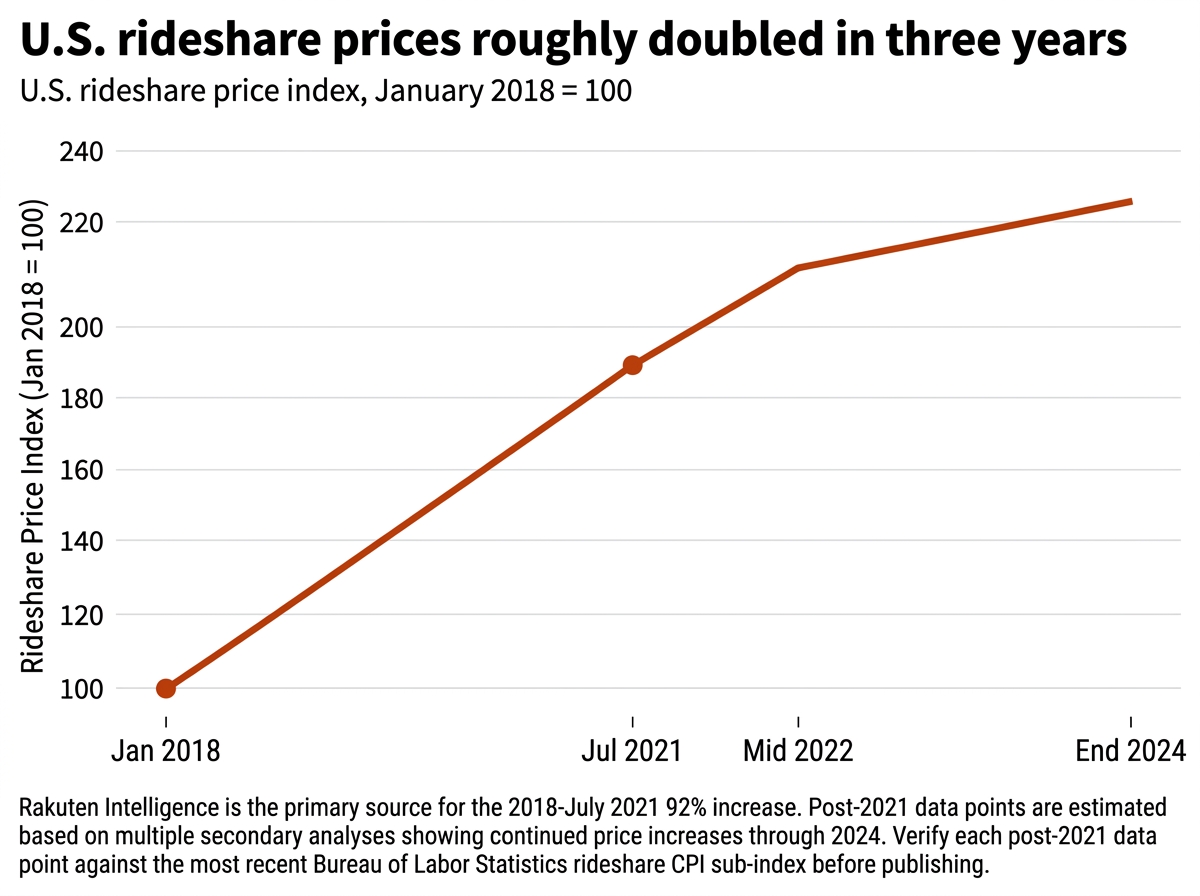
- A U.S. duopoly that lets prices set themselves. Uber holds roughly 76% of U.S. rideshare market share (Bloomberg Second Measure, March 2024); Lyft holds the rest. Rakuten Intelligence data showed average U.S. rideshare prices rising 92% from January 2018 to July 2021.
- A take rate that doubled. A Drivers Union Washington analysis of 1.4 million Seattle trips found Uber’s average per-trip take rose from $4.69 (2019) to $13.06 (2024) — a 178% increase. Average take rate is now ~35%, up from the original 20%.
- A high-margin advertising business that didn’t exist five years ago. Uber Ads passed a $1.5 billion annual revenue run rate in Q1 2025, growing more than 60% year-over-year.
One critical caveat the headlines skip: 2024’s $9.86 billion in net income was inflated by a $6.4 billion one-time non-cash gain from the release of a deferred tax asset, recorded as Uber concluded enough future taxable income was probable to recognize previously unrecognized tax credits. Strip that out, and underlying operating profit was $1.87 billion — still real, but an order of magnitude smaller than the headline number suggests.
This isn’t a story about better technology. It’s a story about a company that outlasted every competitor with deeper pockets, took equity stakes in the markets it lost, settled into a comfortable U.S. duopoly with one weak rival, and started raising prices and take rates the moment it had nowhere left for users to flee.
Skip to the section that interests you most
What Most Coverage Gets Wrong
Open any post-2023 Uber profitability piece and the explanations cluster around three claims. First: the algorithm got smarter. Second: network effects finally tipped — more drivers attracting more riders attracting more drivers. Third: scale economics kicked in as fixed costs got spread across higher trip volume.
Each of these is partially true. None of them is the explanation.
The algorithm-and-network-effects narrative cannot account for the timing. Uber hit roughly 1 billion monthly trips by mid-2018 and processed more than 6 billion trips that year. The network was already enormous. If network effects were the driver of profitability, the company should have flipped to profit somewhere between 2018 and 2020. It didn’t. It posted a $8.51 billion net loss in 2019, a $6.77 billion loss in 2020, and continued losing money through 2022. The network was already dense; the profits were not.
The scale-economics story has the same problem. Uber’s gross bookings grew from $50 billion in 2018 to $162 billion in 2024 — 224% growth. Revenue grew from $11.3 billion to $43.9 billion — 289%. Both are massive scale gains. But operating margins didn’t expand smoothly during that period. They were negative every year from 2014 through 2022 and only turned positive when something more specific happened.
That specific thing is competitive structure. Uber became profitable when it was the only large player left in its core market and the principal acquirer of equity in the markets it left. That’s a different story than a technology story, and the filings document it.
How Much Uber Actually Lost (and What “Profitable” Now Means)
Pull every 10-K from 2014 forward and add them up. Uber’s cumulative GAAP operating losses from 2014 through 2022 were approximately $31.5 billion. The company never posted a profitable full year before 2023. Pre-IPO, the company was burning through investor capital at a rate that would have bankrupted any business without the kind of patient capital it had assembled.
The annual losses, drawn from the 10-Ks:
- 2017: $4.0B operating loss
- 2018: $3.0B operating loss (offset by a $5.0B gain on the Didi/Yandex/Grab divestments — produced a one-time GAAP net profit of $1.0B in 2018)
- 2019: $8.6B operating loss; $8.5B net loss
- 2020: $4.9B operating loss; $6.8B net loss
- 2021: $3.8B operating loss; $0.5B net loss (boosted by Didi stake remeasurement gains)
- 2022: $1.8B operating loss; $9.1B net loss (Didi stake markdowns)
- 2023: $1.1B operating profit (first ever); $1.9B net income
- 2024: $1.87B operating profit; $9.86B net income
Two notes on 2024 in particular. First, that $9.86 billion in net income looks transformational but is significantly distorted by accounting treatment. Approximately $6.4 billion of it came from a one-time non-cash release of a deferred tax asset valuation allowance — meaning Uber concluded it was now probable enough that future taxable income would let it use previously unrecognized tax credits, so the accountants flowed those credits through the income statement in one quarter. The cash didn’t move. The underlying tax position improved, but the headline number is not a clean read of operational profitability.
The cleaner read is the operating income line: $1.87 billion in 2024, up from $1.11 billion in 2023, on $43.9 billion of revenue. That implies an operating margin around 4.3%. For comparison: Costco runs around 3.5%, Walmart around 4.0%, Amazon around 11%. Uber is now profitable in the way a retailer is profitable, not the way a software platform is profitable. The premium-multiple software story it sold to investors for a decade is structurally different from what the income statement now produces.

This is important context for everything that follows. The narrative that “Uber finally became a great business” requires you to ignore that the operating margin still resembles a low-margin services business and that a meaningful slice of the celebrated 2024 number is accounting recognition rather than cash conversion.
The War Chest: $24 Billion in Patient Capital
Why could Uber lose money for 14 years and still keep operating? Because it had assembled one of the largest pools of patient capital in private-market history.

According to the company’s S-1 filing in April 2019, Uber raised more than $24 billion in equity and debt financing between its founding in 2009 and its IPO. The investor list reads like a directory of every institution that wanted exposure to ride-hailing without building it themselves: SoftBank’s Vision Fund, Saudi Arabia’s Public Investment Fund (PIF), Tencent, Alphabet, Toyota, Goldman Sachs, BlackRock, Tata Capital, Benchmark, First Round, Lowercase, plus dozens more.
Two of those investors mattered more than the rest.
SoftBank. Through a combination of direct primary investment and a 2018 secondary tender offer, SoftBank invested approximately $9.3 billion via its Vision Fund. The 2018 tender alone was a $7.7 billion transaction at a $48 billion company valuation. SoftBank emerged as Uber’s single largest shareholder pre-IPO, owning roughly 16.3% of the company. The Vision Fund’s mandate, articulated publicly by Masayoshi Son, was to capitalize “winner-take-all” markets by funding category leaders to scale beyond competitor reach. Uber was the textbook application.
Saudi Arabia’s PIF. In June 2016, the Saudi sovereign wealth fund wired $3.5 billion to Uber in a single transaction — at the time the largest lump-sum payment ever sent in dollar terms. Yasir Al-Rumayyan, who led the PIF investment, joined Uber’s board. The deal valued Uber at $62.5 billion. PIF’s strategy mirrored SoftBank’s: deploy enormous capital into a few category-defining technology platforms.
The combined effect of those two checks alone was that Uber had access to roughly $13 billion of equity capital from two investors with explicit mandates to fund losses for as long as it took to win. No competitor in any of Uber’s markets — not Didi, not Lyft, not Grab, not Careem — had access to capital pools at that scale on those terms.
This is what made the strategy work. It wasn’t a technology moat. It was a capital moat.
The Three Retreats That Look Like Victories
The single most important thing to understand about Uber’s current profitability is that the company is no longer competing in three of the most expensive markets it ever entered. Each of those exits was structured as an equity exchange, which means Uber recorded gains on the divestitures while ending the cash burn associated with operating in those markets.
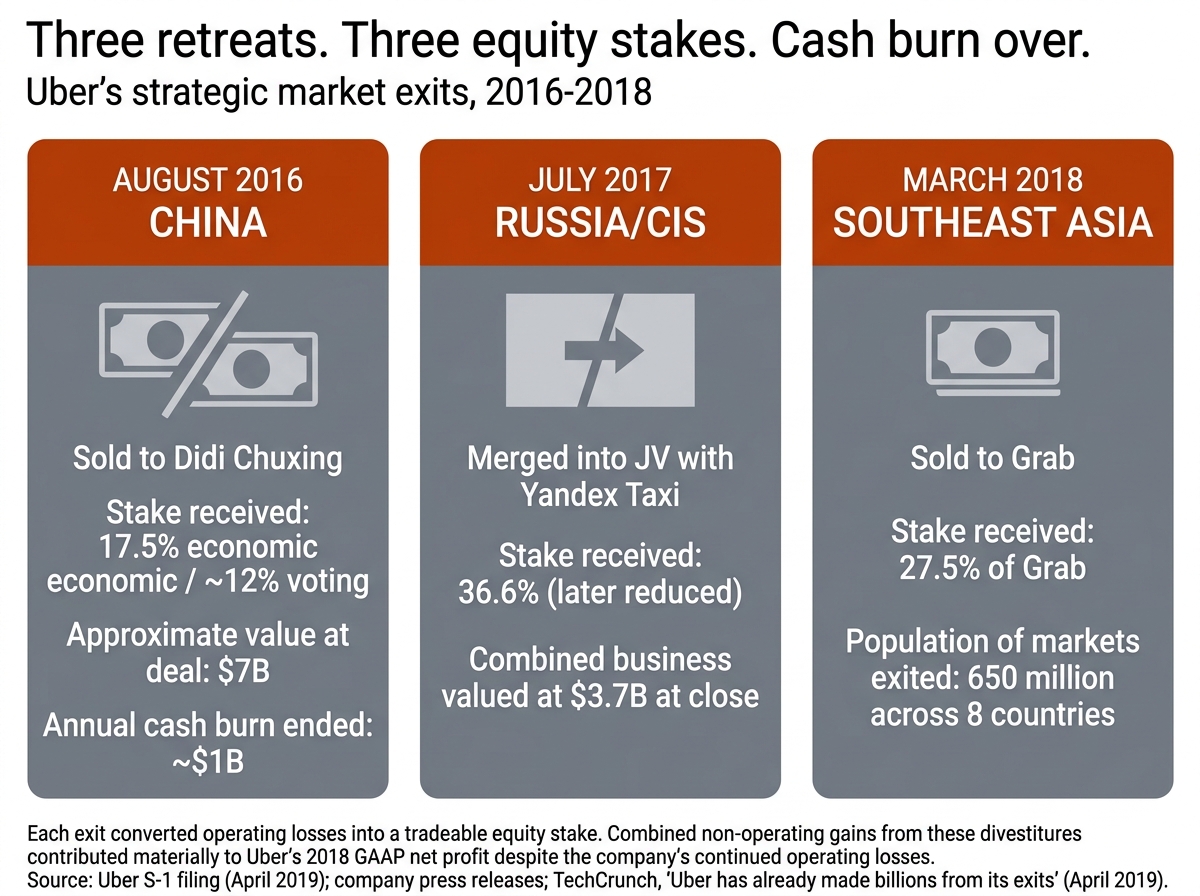
China — August 2016. After more than two years of head-to-head competition with Didi Chuxing, Uber agreed to sell its China business to Didi in exchange for a 17.5% economic stake (roughly 12% voting interest) in the combined entity, plus a $1 billion direct investment from Didi into Uber. The pre-deal annual cash burn in China was reportedly around $1 billion. By Uber’s own filings, the Didi stake was worth approximately $7 billion at the time of the merger and significantly more at later marks.
Russia and Eastern Europe — July 2017. Uber merged its operations across Russia, Armenia, Azerbaijan, Belarus, Georgia, and Kazakhstan into a joint venture with Yandex Taxi. Yandex took 59.3% control; Uber took 36.6% (later reduced through Yandex’s expansion). The combined business was valued at $3.7 billion at deal close. Uber sold remaining stakes back to Yandex in subsequent transactions, ultimately collecting a multiple of the cash burn it had been absorbing in those markets.
Southeast Asia — March 2018. Uber sold its operations across eight Southeast Asian countries (Singapore, Indonesia, Philippines, Malaysia, Thailand, Vietnam, Myanmar, Cambodia) to Grab in exchange for a 27.5% stake in Grab. The deal was Uber’s largest international retreat by population — covering 650 million people — and again converted operational cash burn into a tradeable equity stake.
Across all three deals, a clear pattern. Uber entered, lost money aggressively to take share, and when it became evident it would not win locally against an equally well-funded local incumbent, exited via equity exchange rather than continuing to lose. The retreats weren’t defeats in financial terms — they were strategic conversions of operating losses into balance-sheet investments.
What’s important for the profitability story is what didn’t happen after those exits. Uber’s expense base declined. The cash burn associated with running ride-hailing operations in three of the most competitive markets in the world — populations totaling more than 2 billion — disappeared. The CEO at the time, Dara Khosrowshahi, said Southeast Asia would be Uber’s “last global retreat,” and the company largely held to that. The remaining international operations were either profitable or in markets where Uber held dominant share (Western Europe, Latin America, Australia, parts of MENA after the 2020 Careem acquisition).

By 2018, Uber’s competitive position had fundamentally changed. It was no longer fighting cash-burn wars in mainland China, Russia, or Southeast Asia. It was fighting a single domestic competitor, Lyft, in the United States, and it was the bigger competitor.
The U.S. Duopoly: Why Lyft Was a Gift
A duopoly is not the same as a monopoly. A duopoly with one weak competitor is functionally indistinguishable from one.
Bloomberg Second Measure data (March 2024) showed Uber holding 76% of observed U.S. rideshare consumer spending, with Lyft holding the remaining 24%. Both companies have been roughly stable at those market share levels since 2018. Lyft has never managed to break into international ride-hailing in any meaningful way; its operations are concentrated in North America, where Uber outweighs it by approximately three-to-one in revenue and gross bookings.

Why does this matter for Uber’s profitability? Because in a duopoly with one dominant player, prices are set by the dominant player and matched by the smaller one. Lyft cannot afford a sustained price war — it has neither the international diversification nor the unit economics nor the cash position to absorb extended losses. When Uber raised prices, Lyft raised prices. When Uber raised its take rate from drivers, Lyft raised its take rate too. The data shows it.
Rakuten Intelligence data, reported by CNBC in August 2021, found average U.S. rideshare prices rose 92% between January 2018 and July 2021 — across both platforms. This is exactly the kind of price coordination economists predict in a tight duopoly: not explicit cartel behavior (which would be illegal), but parallel pricing where both companies recognize their mutual interest in higher prices and act accordingly.
The Federal Trade Commission has flagged tight duopolies in technology services as competitive concerns, but no antitrust action has been brought against Uber-Lyft to date. The companies argue they compete on every dimension — pricing, driver pay, service quality. The data suggests prices have moved up roughly in lockstep, however, and consumer choice in the U.S. ride-hailing market is functionally bounded by what one of two companies decides to charge.
For Uber, this is the structural answer to “what changed in 2023.” Not technology, not the algorithm, not network effects. The answer is that in a duopoly with a meaningfully weaker partner, the dominant player can raise prices and take rates without losing share, because the alternative (the smaller competitor) cannot undercut without going bankrupt itself.
The Price Increases (and the Driver Squeeze)
This is the section that requires distinguishing two different mechanics that look similar but operate differently. Both happened. They are not the same thing.
Mechanic 1: Rider prices went up. Rakuten’s 92% increase between January 2018 and July 2021 captures this. Multiple later analyses (Slate, Reuters) corroborate that U.S. ride-hailing prices kept climbing through 2022 and 2023, with the Slate analysis citing a 45% increase between 2019 and 2022 specifically. The post-pandemic period accelerated this because drivers had left the platform during COVID, and Uber/Lyft had to attract them back with higher pay — funded by raising rider fares.
Mechanic 2: Uber’s share of each fare went up. This is the take-rate story, and it’s where the most rigorous primary-source data is the Drivers Union Washington analysis.
In August 2025, Drivers Union Washington (affiliated with Teamsters Local 117) published Taking Seattle for a Ride, a study of 347 Uber drivers’ tax summaries covering 1,414,553 trips between 2019 and 2024. The methodology: drivers’ Uber-issued annual tax summaries report both gross rider charges and net driver payouts; the difference is Uber’s per-trip take.
Findings:
- Uber’s average per-trip take in Washington rose from $4.69 in 2019 to $13.06 in 2024 — a 178% increase.
- That increase was more than double the rate of driver wage growth over the same period.
- Average take rate as a share of rider price reached approximately 35% in 2024, up from the original ~20% when Uber launched.
Uber pushed back on the methodology, noting the sample size is small relative to total Washington trips and that Uber’s official documents categorize gross rider charges as driver “earnings” before company deductions. Uber has also argued that rising prices are driven primarily by Seattle’s minimum-pay regulations for drivers, which took effect in recent years.
A separate Columbia Business School study by Professor Len Sherman (published roughly the same time as the Drivers Union report) used a different methodology — analyzing tens of thousands of trips and 2 million ride requests across eight U.S. cities — and reached a similar directional finding: Uber’s share of trip fares rose from approximately 32% in 2022 to over 42% by Q4 2024. The rate of increase was attributed to “upfront pricing,” which sets fares based partly on what an algorithm predicts a rider will pay and what a driver will accept, rather than a fixed commission.
The two studies use different data and different methods, and both arrive at the same conclusion: Uber’s per-trip take has risen substantially faster than either driver wages or rider price inflation.
Combine the two mechanics. Rider prices rose 92%+ over five years. Uber’s share of each fare rose from ~20% to ~35% over six years. Driver pay rose, but at roughly half the rate of either of the above. The structural outcome is exactly what you’d expect from a profitability turnaround: more revenue per trip flowing to Uber’s income statement, less flowing to drivers, and a customer base with limited substitution options.
This is not a sustainable equilibrium indefinitely — drivers can leave (and have, per the Drivers Union “Empty Miles” follow-up report), and regulators are paying attention. But for the 2023-2024 profitability inflection, it’s the dominant explanation.
The Real Thesis: Outlasting
Step back from the individual mechanics and the structure of Uber’s profitability becomes clean.
Phase 1 (2009-2016): Raise enormous capital, deploy it to subsidize fares and acquire customers globally, accept negative unit economics as the price of share.
Phase 2 (2016-2018): Identify the markets where Uber would not win on operating economics alone, exit them by exchanging operating positions for equity stakes in the local winners. Reduce expense base while preserving long-term financial exposure to those markets.
Phase 3 (2018-2022): Consolidate the U.S. duopoly with Lyft and a few profitable international markets. Continue investing in food delivery (Uber Eats), freight, and the operating platform. Absorb COVID disruption, which paradoxically helped by destroying weaker rivals globally.
Phase 4 (2022-2024): Raise prices. Raise take rates. Add high-margin revenue streams (advertising, membership). Watch operating income flip from -$1.8B to +$1.87B.
The popular term for this is “harvest mode” — the phase of a platform’s lifecycle where the strategic investment is finished and the management runs the business for cash flow. Amazon Prime did it after a decade of free shipping subsidization. Netflix did it after a decade of content investment subsidized by debt. Spotify is in the early stages of doing it now. The pattern is identical: invest losses for a decade to win share, then convert share into pricing power once the alternatives have been weakened or eliminated.
Uber’s specific path to that harvest mode required outlasting better-funded local competitors, settling for equity in the ones it couldn’t beat, and ending up in a domestic market where the one remaining competitor lacked the resources to defend against price increases.
That’s the real story. It’s not a technology disruption. It’s a capital and competitive structure story. The technology mattered only as the operating layer that let Uber convert capital and competitive position into cash.
The Monopoly Endgame: Uber Ads
The final mechanic in the profitability turnaround is the part most retail investors and analysts haven’t priced in yet, because the business is too new.
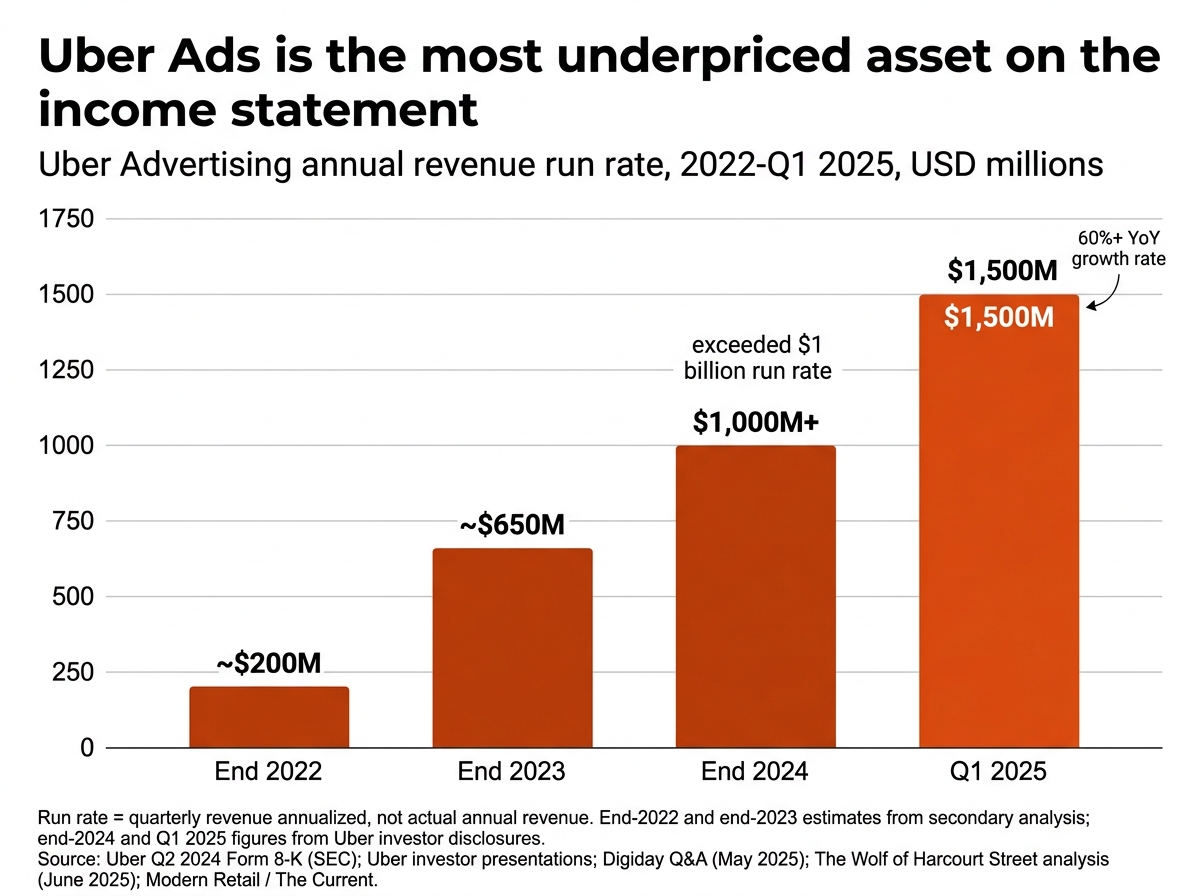
Uber formally launched its advertising division in late 2022. Today, Uber Ads serves ads in-app, in rider emails, on car-top displays, and in-car tablets. The business reports surpassed a $1.5 billion annual revenue run rate as of Q1 2025, growing more than 60% year-over-year. At that growth rate, the business could approach $3 billion in annual revenue within two years.
The economics of advertising revenue are dramatically different from the economics of ride-hailing revenue. A dollar of ride revenue carries the cost of paying drivers, subsidizing rides, processing payments, handling support, managing insurance. A dollar of ad revenue carries almost none of those costs. Industry-standard incremental margin on retail-media advertising businesses runs 60-80%; some pure-play ad networks operate at incremental margins above 80%.
Stack a $3 billion ad business at 70% incremental margin onto Uber’s existing P&L, and the math gets transformative quickly. That’s roughly $2.1 billion in incremental operating profit on a base that did $1.87 billion in operating profit in all of 2024 — meaning the ad business alone could approach the full 2024 operating profit within 24-36 months.
But here’s the part that connects back to the outlasting thesis: advertising businesses only work at scale if you have a captive audience. Google’s ads work because users have nowhere else to go for search. Amazon’s ads work because shoppers are already on the buying surface. Uber’s ads work because riders open the app already needing a ride and have no functional alternative to receive that ride at the same price elsewhere.
Without the duopoly structure — without the price increases, the take-rate increases, the lack of substitution — the ad business would not be defensible. A user who could easily switch to a 30% cheaper ride alternative would pay no attention to in-app ads about restaurant promotions. A user with no alternative scrolls.
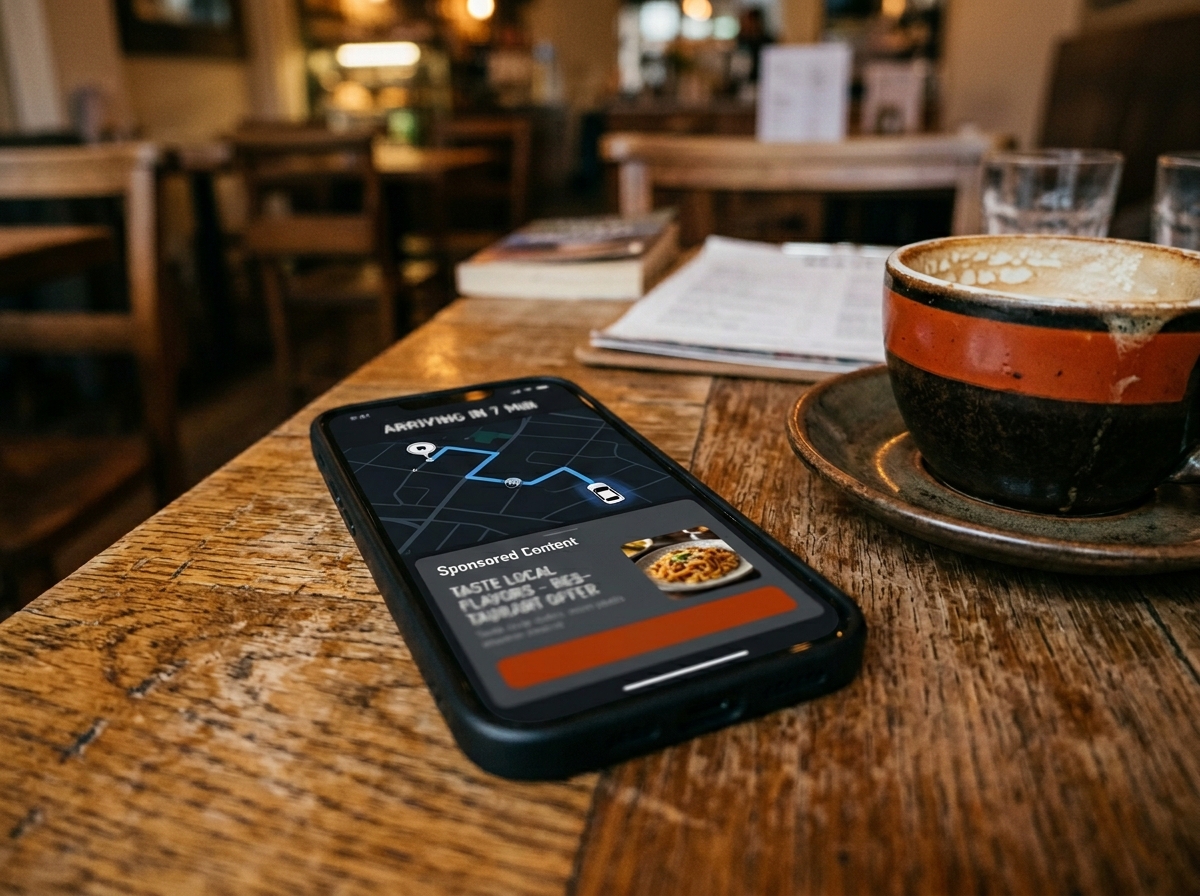
This is the monopoly endgame: convert captive attention into advertising revenue at margins ride-hailing never produced. The S&P 500 will eventually price this in. The articles celebrating Uber’s profitability will eventually catch up to the fact that the most valuable thing the company built isn’t the algorithm — it’s the surface area where everyone in America has to look while waiting for their ride.
What Happens Next
The bull case for Uber, in its current form, is straightforward. The company has finished its growth-phase capital deployment. It operates in a structurally consolidated U.S. market with one weakened competitor. It has multiple high-margin secondary businesses (advertising, Uber One membership) growing 50%+ year-over-year. Cash flow conversion is improving every quarter. Free cash flow in 2025 (per the most recent investor materials) is approaching $10 billion annually. Stock buybacks are absorbing $20 billion of equity over the next several years.
The bear case has three pieces.
First, regulatory exposure. The Drivers Union and Columbia studies are early signals of a broader regulatory investigation into the take-rate structure. State minimum-pay laws (Washington, New York, Massachusetts, California) are setting floors on driver compensation that Uber must absorb either through margin compression or higher rider prices. Either response erodes the duopoly’s pricing equilibrium.
Second, autonomous vehicles. Waymo’s expansion (San Francisco, Phoenix, Los Angeles, Austin, Miami, Nashville as of 2025-2026) introduces a third competitor that does not rely on the driver supply Uber and Lyft must compete for. If autonomous services scale to 10-20% of the U.S. ride-hailing market by 2030, the duopoly equilibrium that supports current pricing breaks. Uber has positioned itself as a partner platform for Waymo and other AV operators, but the partnership economics are still uncertain. The company that captures the rider relationship in an AV-dominant market will not necessarily be Uber.
Third, the customer is paying attention. The 92% price increase in three years, the 178% take-rate increase in five, and the share of fare drop for drivers from 80% to 65% are all observable to consumers and labor markets. Negative consumer sentiment around ride-hailing pricing has been building since 2022. Eventually, that sentiment translates either into regulatory intervention or behavioral substitution (taxis, public transit, car ownership, autonomous services as they arrive).
For the investor, the question is not “is Uber profitable” — it clearly is. The question is “for how long does the structure that produced this profitability remain intact.” The answer depends on three independent variables: regulators, autonomous vehicles, and consumer behavior. None of them is fully under Uber’s control.
The Headline Takeaway
Uber became profitable not because the technology got better but because the competition got smaller. After 14 years of losses, the company emerged into a market where it had no remaining major rivals in three of the four largest non-U.S. ride-hailing regions, where it held 76% domestic share against a structurally weaker domestic competitor, and where it had built the patience and capital to survive long enough to start raising prices.
The 2024 net income headline of $9.86 billion is real but misleading — the bulk of it is non-cash deferred tax recognition. The 2024 operating income of $1.87 billion on $43.9 billion of revenue is the cleaner read, and it shows a profit margin closer to a high-end retailer than the premium-software business Uber sold itself as for a decade.
The actual story is structural, and once you see it, the “Uber turned the corner” coverage looks like exactly what most financial coverage looks like: people working backwards from outcomes to explanations, and missing the part where the explanation has been visible the entire time.
The headlines will keep crediting the algorithm. The filings will tell you it was always about who else was left in the room.
Frequently Asked Questions
How did Uber become profitable?
Uber became profitable in 2023 — its first full year of operating profit in 14 years — through a combination of structural and competitive factors that have nothing to do with technology improvements. The key drivers: $24+ billion in patient venture capital that allowed Uber to absorb losses competitors couldn’t match; strategic exits from China (2016), Russia (2017), and Southeast Asia (2018) that converted operating losses into equity stakes worth billions; settling into a U.S. duopoly with Lyft where Uber holds 76% market share; raising U.S. rider prices 92% between 2018 and 2021; and increasing the company’s take rate per trip from approximately 20% historically to ~35% by 2024. Uber reported $1.87 billion in operating profit on $43.9 billion of revenue in 2024.
How much did Uber lose before becoming profitable?
Uber’s cumulative operating losses from 2014 through 2022 totaled approximately $31.5 billion. The company never posted a profitable full year before 2023. Annual operating losses peaked at $8.6 billion in 2019, the year Uber went public. Total paid-in investor capital through the IPO and subsequent offerings exceeded $40 billion. The company funded these losses primarily through SoftBank’s Vision Fund (~$9.3 billion), Saudi Arabia’s Public Investment Fund ($3.5 billion in 2016 alone), and a wide pool of venture and strategic investors.
Is Uber actually profitable in 2024?
Yes, but with caveats. Uber reported $9.86 billion in net income for 2024, but approximately $6.4 billion of that came from a one-time non-cash release of a deferred tax asset valuation allowance — meaning Uber recognized previously unbooked tax credits in one quarter. The cleaner read is operating income of $1.87 billion on $43.9 billion of revenue (~4.3% operating margin) — comparable to Walmart and Costco, well below software platforms. Uber’s underlying business is profitable, but the headline net income number significantly overstates the cash-generating power of the underlying operations.
How does Uber make money now?
Uber’s three main revenue streams are mobility (ride-hailing) at roughly 57% of 2024 revenue, delivery (Uber Eats and grocery) at roughly 31%, and freight at the remainder. Across these segments, Uber earns its commission (“take rate”) from each transaction, which has risen from approximately 20% historically to ~35% in 2024 according to driver-side analyses. Uber also operates a fast-growing advertising business — Uber Ads — that surpassed a $1.5 billion annual run rate in Q1 2025, growing 60%+ year-over-year. Advertising carries higher incremental margins than ride-hailing and is becoming an increasingly important profit contributor.
Why is Uber so expensive now?
Two distinct factors are increasing rider prices. First, Uber’s share of each fare (the take rate) has risen significantly — from ~20% historically to ~35% in 2024, per the Drivers Union Washington analysis of 1.4 million Seattle trips. Second, total fare prices have risen faster than inflation: Rakuten Intelligence data showed U.S. rideshare prices rising 92% between January 2018 and July 2021. Both increases reflect the same underlying structure: in a U.S. duopoly with a weaker competitor (Lyft, at 24% market share), Uber can raise prices without losing share because the alternative cannot meaningfully undercut without going bankrupt itself.
Did Uber leave China?
Yes. In August 2016, Uber sold its China business to local rival Didi Chuxing in exchange for a 17.5% economic stake (about 12% voting interest) in the combined entity, plus a $1 billion direct investment from Didi. The deal ended an estimated $1 billion per year in cash burn that Uber had been absorbing in the Chinese market. Uber’s stake in Didi was valued at approximately $7 billion at the time of the merger and has been a meaningful contributor to Uber’s balance sheet and non-operating gains/losses ever since.
How big is Uber’s advertising business?
Uber Advertising surpassed a $1.5 billion annual revenue run rate as of Q1 2025, growing more than 60% year-over-year. The business launched formally in late 2022 and serves ads through the Uber and Uber Eats apps, in rider confirmation emails, on car-top displays, and on in-car tablets. At roughly 3-4% of Uber’s 2024 total revenue, the ad business is small in absolute terms but growing far faster than the rest of the company. Industry-standard incremental margins on retail-media advertising businesses run 60-80%, meaning the ad business is disproportionately important to Uber’s incremental profitability even at its current size.
Is Uber a monopoly?
Legally, no. Uber is part of a U.S. duopoly with Lyft, which holds approximately 24% market share to Uber’s 76% (Bloomberg Second Measure, March 2024). Globally, Uber’s share is closer to 25%, with significant share held by Didi (China), Grab (Southeast Asia), Yandex/Yango (Russia/CIS), and others. However, in tight duopolies with one dominant player, prices and policies often move in parallel without explicit coordination — economists call this “tacit collusion.” The fact that U.S. rideshare prices rose 92% across both Uber and Lyft simultaneously between 2018 and 2021 is consistent with that pattern. Antitrust regulators have flagged ride-hailing as a watch area but have not brought formal action.
Footnote Brief reads public companies’ filings so you don’t have to. Twice-weekly breakdowns at footnotebrief.com.
Sources: Uber S-1 Filing (April 2019); Uber 10-K filings (2017-2024); Uber Q1-Q4 2024 earnings releases (SEC); Drivers Union Washington — “Taking Seattle for a Ride” report (August 2025); Columbia Business School — Len Sherman upfront-pricing study (August 2025); Bloomberg Second Measure — U.S. rideshare market share data (March 2024); Rakuten Intelligence price data via CNBC (August 31, 2021); Slate (May 2022) — U.S. rideshare price comparisons; Crunchbase — Uber funding totals; Vision Fund / SoftBank disclosures (2017-2018); Saudi Public Investment Fund 2016 transaction reporting; TechCrunch (April 2019) — Uber exits and equity gains; Reuters / Fortune / Daily Star / Phys.org — China, Russia, and Southeast Asia exit deal coverage (2016-2018); Digiday / The Current / Modern Retail / Yahoo Finance / Motley Fool / The Wolf of Harcourt Street — Uber Ads run rate and growth data (2025); KING5 / Seattle Times / The STAND — Drivers Union study coverage and Uber response.